Job Costing and Profitability Tracking for Painting Contractors
18 April 2026 · ProPainterTools
Job Costing and Profitability Tracking for Painting Contractors
Estimating a job correctly is only half the work. Knowing whether the job actually delivered the margin you estimated requires job costing — tracking what you actually spent against what you planned to spend. Most painting contractors who feel like they are always busy but never getting ahead have a job costing problem: they are producing revenue but not consistently capturing profit, and they cannot identify which jobs, crew members, or task types are eating their margin. This guide covers the structure of a job cost report, how to track labour and material variances, and how to use costing data to improve future estimates.
Why Job Costing Matters
A painting business has four ways to improve profitability: charge more, spend less on labour, spend less on materials, or reduce overhead per job. Job costing tells you which of these levers is actually moving, and by how much, on each job.
Without job costing:
- You win jobs at the right price but lose money because crew productivity is lower than estimated
- You consistently underestimate material on certain job types and absorb the overage
- You finish every job thinking it went well, but the bank account does not agree with the P&L
With job costing:
- You know within hours of job completion whether the job hit target margin
- You can identify which estimator, crew leader, or job type produces margin and which does not
- Your estimates improve over time because you are calibrating against real data
The Job Cost Report Structure
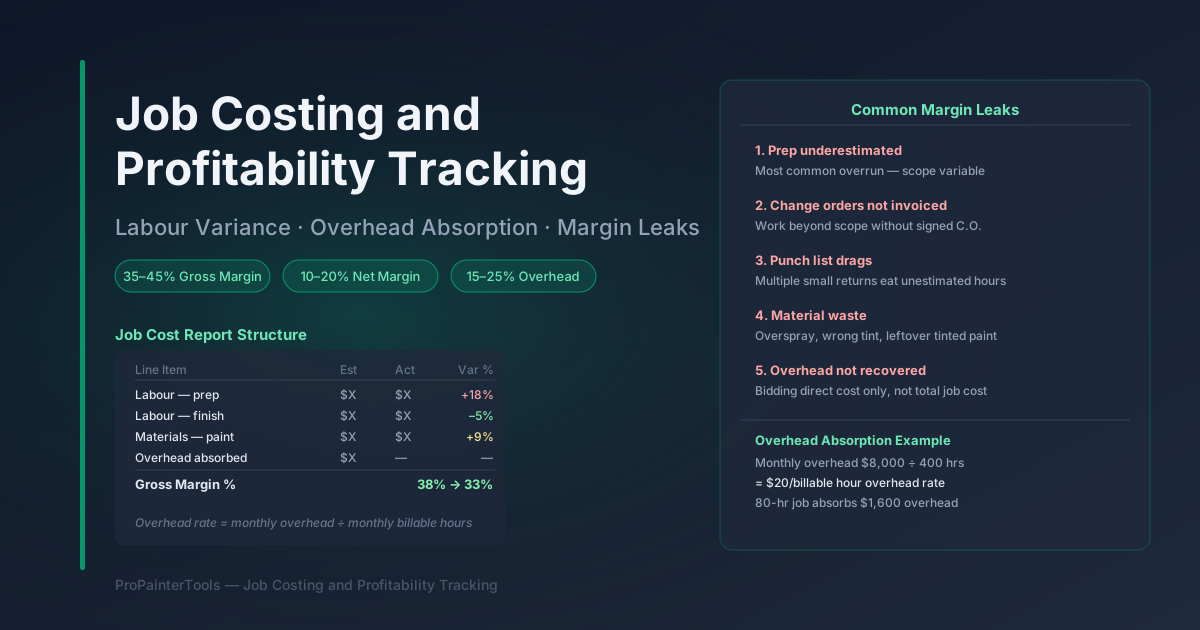
A job cost report compares estimated costs against actual costs at the task or line-item level. For a painting contractor, the minimum structure is:
| Line Item | Estimated | Actual | Variance | Variance % |
|---|---|---|---|---|
| Labour — prep | $X | $X | $X | % |
| Labour — prime | $X | $X | $X | % |
| Labour — finish coat(s) | $X | $X | $X | % |
| Labour — total | $X | $X | $X | % |
| Materials — paint | $X | $X | $X | % |
| Materials — sundries | $X | $X | $X | % |
| Materials — total | $X | $X | $X | % |
| Subcontractors | $X | $X | $X | % |
| Equipment / rental | $X | $X | $X | % |
| Total direct cost | $X | $X | $X | % |
| Overhead allocated | $X | $X | — | — |
| Total job cost | $X | $X | $X | % |
| Revenue | $X | $X | — | — |
| Gross margin | $X | $X | $X | % |
| Gross margin % | % | % | — | — |
A variance column (actual minus estimated) immediately highlights where the job ran over or under. Positive variance (actual higher than estimated) is a cost overrun — this is where you look first.
Labour Variance Analysis
Labour is typically 35–50% of revenue for a painting contractor and is the largest controllable variable. Labour variance is the difference between estimated hours (at estimated productivity) and actual hours worked on each task.
Tracking actual labour hours: Every worker logs hours by job and by task (prep, prime, finish, cleanup). This can be done with a paper timesheet, a whiteboard on the truck, or a time-tracking app. The task breakdown is critical — "painting" as a single category hides the variance. You need to know whether the overrun is in prep (under-scoped) or finish (slow crew) or cleanup (job site condition).
Calculating labour variance:
Labour Variance = (Estimated hours × Burdened rate) − (Actual hours × Burdened rate)
A negative variance means you spent more on labour than estimated. A positive variance means you ran faster than expected.
Root causes by task:
| Overrun Location | Common Cause |
|---|---|
| Prep hours over | Scope creep — more surface damage than quoted |
| Prime hours over | Substrate more absorptive than expected; wrong number of coats |
| Finish hours over | More coats required; lower crew productivity than PCA P10 |
| Cleanup over | Job site access or client presence slowed work |
| All tasks over | Estimate used wrong production rates for this job type |
For production rate benchmarks by task type, see our estimating guide which covers PCA P10 rates in detail.
Material Usage Tracking
Material overruns are less common than labour overruns for most contractors, but they are easier to measure and control once you have a system.
Theoretical vs actual material usage:
- Calculate theoretical material usage from the estimate: area ÷ coverage rate = litres required.
- Record actual material used: count cans opened at the job (beginning inventory minus ending inventory plus any cans brought back).
- Compare: if actual significantly exceeds theoretical, investigate.
Common causes of material overrun:
- Misquoted area (takeoff error)
- Extra coats required (substrate condition, colour change, mis-specified product)
- Applied at thicker than specified WFT
- Overspray waste higher than expected on exterior spray
Material tracking by job: Keep a simple tally per job: "3 × 4-gallon pails of SW Emerald Flat, 2 × 1-gallon trim". This takes 30 seconds at job close and gives you the actual material cost against the estimated material cost.
Overhead Absorption
Overhead is the cost of running the business that cannot be directly attributed to a single job — insurance, vehicle costs, office rent, marketing, owner salary, tools and equipment. Overhead must be recovered through the margin on individual jobs.
Overhead absorption rate: Calculate monthly overhead, divide by monthly billable hours, and add this rate to your labour cost per job.
Example:
- Monthly overhead: $8,000
- Monthly billable hours: 400
- Overhead rate: $8,000 ÷ 400 = $20 per billable hour
If a job uses 80 billable hours, it must absorb $1,600 of overhead to contribute to covering fixed costs.
Per-job overhead allocation: Add the overhead absorption amount to each job cost report. If the job's revenue after direct costs (labour + materials + subs) minus overhead absorption is positive, the job contributed to net profit. If it is negative after overhead, the job lost money even if the gross margin looked acceptable.
Overhead as % of revenue: For many painting contractors, overhead runs 15–25% of revenue. If your overhead is 20% of revenue and your direct cost is 65%, your net margin before owner compensation is approximately 15%. Tracking this ratio monthly prevents the situation where revenue grows but profitability does not.
Identifying Margin Leaks
Once you have 10+ job cost reports, patterns emerge. Sort your jobs by gross margin % and look for what the bottom quartile has in common:
- Job type: Do exterior repaint jobs consistently underperform vs interior? Are commercial jobs better margin than residential?
- Estimator: If multiple people estimate, does one estimator's jobs consistently run over?
- Crew: Does one crew consistently log more hours per square metre than the benchmark?
- Scope: Do jobs with significant prep work overrun more than finish-only jobs? (This usually means prep is being under-scoped or under-charged)
- Client type: Do referral clients behave differently than leads from a directory? Do repeat clients negotiate tighter margins?
Common margin leaks for painting contractors:
- Prep underestimated: The single most common cause of overruns. Prep is variable and harder to estimate than finish work.
- Change orders not invoiced: Work done beyond the original scope without a signed change order.
- Punch list drags: Returning for multiple small punch list items eats hours that were not in the estimate.
- Material waste: Spray overspray, unused tinted paint, incorrect product ordered.
- Overhead not recovered: Bidding to cover direct costs but not allocating overhead correctly.
Job Costing for Small Operations
For a one- or two-person operation, a simple spreadsheet with the columns above — run after every job — provides the data you need. The key discipline is consistency: run the report on every job, not just the ones you feel went badly.
A simple process:
- At job close: tally actual hours by task (from timesheets) and actual material used.
- Pull the estimate from your quote and fill in the "actual" column.
- Note variances above 10% in any category.
- Review the three highest-variance jobs each month and identify root causes.
When to invest in software: Purpose-built job costing software (Jobber, BuilderTrend, Co-Construct) adds value when you have 5+ active jobs concurrently and the manual tally becomes time-consuming. At smaller scale, a spreadsheet beats a complex tool you will not use consistently.
ProPainterTools is built specifically for painting contractors to track estimates, logged hours, and material usage per job — giving you the job cost data to identify margin leaks without a separate spreadsheet. See how the materials calculator and labour tracking work together at ProPainterTools.
For the estimating side of the equation — how to set production rates, calculate material quantities, and price correctly from the start — see our estimating painting jobs guide. For invoicing and collections once the job is complete, see our invoicing and collections guide.
Frequently Asked Questions
How many jobs do I need before job costing data is useful? Ten jobs in the same category (e.g., residential exterior) is the minimum for meaningful pattern recognition. After 25–30 jobs, you have enough data to validate production rates, identify outlier jobs, and track trend direction.
My crew doesn't fill out timesheets reliably — what do I do? Start with a simple end-of-day crew leader report: total hours by job for the crew. One number per job per day. This is trackable in a text message. Granularity by task can come later — the first step is reliable total hours.
What is a good gross margin target for a painting contractor? Industry benchmarks vary by company size and mix, but 35–45% gross margin (revenue minus direct labour and materials) is a sustainable target for most residential and light commercial painting contractors. Above 50% is excellent; below 30% typically signals a pricing or efficiency problem. Net margin (after overhead) should be 10–20% for a well-run operation.
How do I handle jobs where one task ran way over but others ran under? Task-level variances offset each other at the job level, but the task-level data is still valuable. If prep always runs over but finish always runs under, you are mis-allocating time between tasks in your estimate — adjust the task breakdown without changing the total, and see if the pattern normalises.
